The VIX Is Wall Street's Fear Gauge: What It Is and How It Affects Your Portfolio


Erik James Roberts — Founder & CIO, Infinitus Wealth Management. Purple Heart recipient, Wharton MBA.
Updated October 22, 2026
Wall Street's fear gauge, the VIX, is the Cboe Volatility Index: a real-time number that reflects how much movement the options market expects from the S&P 500 over the next 30 days. A VIX reading of 20 means option prices are implying an annualized swing of about 20 percent, which works out to roughly a 5.8 percent move in either direction over the coming month. It is not a prediction of direction, and it is not a measure of what already happened. It is the market's live estimate of how wide the road ahead might be.
That distinction matters, because the nickname does a lot of damage. The fear gauge gets more airtime than almost any other number in finance, and most of that airtime treats every uptick as an alarm bell. Investors who understand what it is actually measuring tend to see it differently: as a useful piece of context that tells you how much turbulence is already priced in, and therefore how much of today's headline is already old news to the people writing option prices.
As I write this on the morning of October 22, 2026, the VIX is trading near 19, up from a close under 17 the day before. That puts it right around its long-run average and a little above its 200-day average of about 18. Over the past twelve months it has ranged from a low near 13 to a high just above 35. Keep those numbers in mind, because the rest of this article is about what they mean.
What Is Wall Street's Fear Gauge Measuring, and How Is It Calculated?
The VIX measures implied volatility: the level of future price movement that option traders are collectively willing to pay for. Cboe calculates it from the prices of a wide range of S&P 500 index options expiring between 23 and 37 days out, then interpolates to a constant 30-day horizon and annualizes the result. Nobody votes. Nobody fills out a sentiment survey. The number falls out of real money changing hands.
Think of it like the premium on an insurance policy. When the people buying protection on the S&P 500 are nervous, they pay more for it, and the VIX rises. When they are comfortable, premiums fall and the VIX drifts lower. Because the index is built from the cost of protection rather than from stock prices themselves, it can rise even on a day when the market is flat, if traders decide the coming weeks look less certain than they did yesterday.
The original VIX launched in 1993 and was based on S&P 100 options. In 2003, Cboe moved it to the S&P 500 and to the broader methodology still in use today, and it published back-calculated history to 1990, which is why VIX data runs further back than the modern index itself.
The single most useful thing you can do with the VIX is translate it. Divide the reading by the square root of twelve, which is about 3.46, and you get the one-month move the market is pricing as a one-standard-deviation outcome:
VIX at 12: roughly a 3.5 percent monthly move
VIX at 15: roughly 4.3 percent
VIX at 20: roughly 5.8 percent
VIX at 30: roughly 8.7 percent
VIX at 40: roughly 11.5 percent
VIX at 60: roughly 17.3 percent
A one-standard-deviation move means the market is implying about a two-in-three chance that the S&P 500 lands inside that range over the next 30 days, and about a one-in-three chance it lands outside it. That is the whole number. Once you can do that arithmetic in your head, Wall Street's fear gauge stops being a mood ring and starts being a ruler.

What Is a Normal VIX Level?
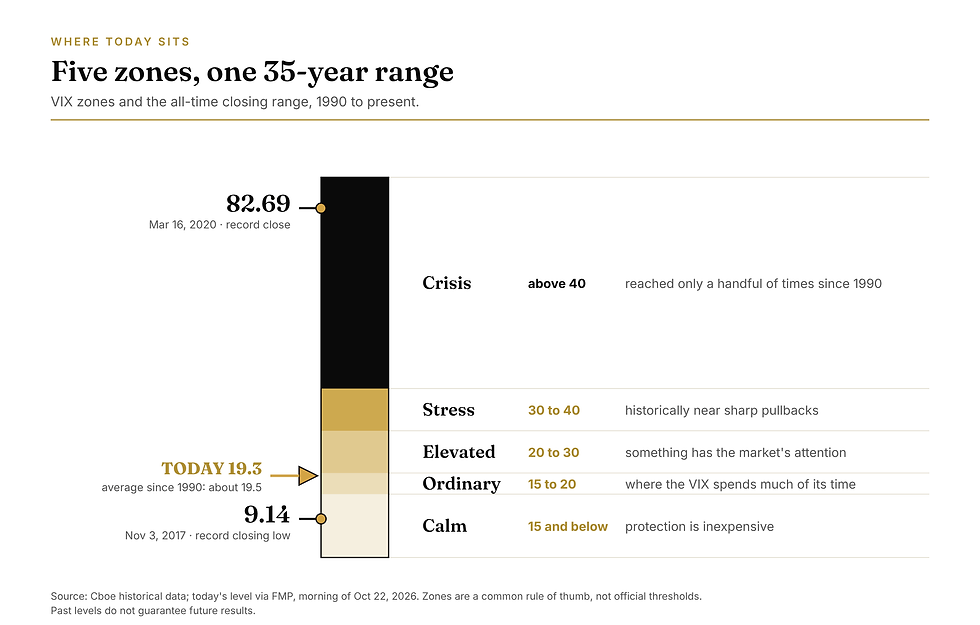
A normal VIX level is in the high teens. Since 1990 the index has averaged about 19.5, and the median is lower, because the average gets pulled upward by a handful of extreme spikes. Most trading days in the index's history have closed between 12 and 25.
Here is a rough map of the zones investors use:
Below 15: a calm market. Option protection is inexpensive, and expected monthly moves are in the 3 to 4 percent range.
15 to 20: ordinary. This is where the VIX spends a great deal of its time.
20 to 30: elevated. Something has the market's attention, whether it is an earnings season, a Federal Reserve decision, or a geopolitical headline.
30 to 40: stress. Readings here have historically clustered around sharp pullbacks and corrections.
Above 40: crisis territory, reached only a handful of times in three and a half decades.
The record closing high is 82.69, set on March 16, 2020, in the first weeks of the pandemic. The 2008 financial crisis produced a close of 80.86 on November 20, 2008, and an intraday print of 89.53 a few weeks earlier. At the other end, the record closing low is 9.14, set on November 3, 2017, in the middle of one of the quietest years the stock market has ever had.
So where does today's reading of roughly 19 fit? Squarely in the ordinary zone, with option prices implying a monthly move of a little under 6 percent. That is useful perspective on a morning when the index jumped more than 15 percent in a single session. A big percentage move in the VIX is not the same thing as a big absolute level, and headlines routinely conflate the two. If you have ever wondered what Wall Street's fear gauge is really saying on a day like that, the answer is usually “less than the chyron suggests.”
What Does a High VIX Mean for the Stock Market?
A high VIX means the options market expects wider swings in the S&P 500 over the next month, and it almost always coincides with a falling market rather than a rising one. The daily correlation between changes in the VIX and changes in the S&P 500 is strongly negative, commonly measured in the range of minus 0.7 to minus 0.8. Stocks go down, demand for protection goes up, the VIX rises. Stocks recover, protection gets cheaper, the VIX falls. That is the whole reason it earned the fear gauge name. It is a thermometer for demand for protection, and that demand runs highest when prices are already falling.
Two historical patterns are worth knowing, with the standard reminder that past behavior does not guarantee anything about the future.
First, VIX spikes have tended to be short-lived relative to the declines that caused them. After the August 5, 2024 spike, when the index briefly traded above 65 intraday and closed at 38.57, it first closed back below 20 on August 13, eight days later. After the April 8, 2025 close of 52.33 during the tariff shock, it first closed back below 20 about five weeks later, on May 12. After the March 16, 2020 record, it first closed below 30 about seven and a half weeks later, on May 8, though it retested 40.79 in June. Implied volatility has a strong tendency to revert toward its average, because elevated option premiums attract sellers and because the news that caused the spike eventually gets priced.
Second, implied volatility has historically run higher than the volatility that actually materialized. In other words, the market has tended to pay more for protection than the following 30 days turned out to require. This gap is known as the volatility risk premium, and it exists for a sensible reason: the people buying protection are paying to sleep at night, and the people selling it demand compensation for the rare occasions when the swing is bigger than expected.
What does that mean for someone who owns a portfolio of businesses rather than a trading book? Mostly this: a VIX spike tells you that uncertainty is high and that protection is expensive right now. It does not tell you that the next month will be bad, and it does not tell you that stocks are mispriced. What it often does signal is opportunity for the patient. When the VIX is elevated, price moves get larger across the board, and the spread between where a stock trades and what the business underneath it is worth can widen considerably in a short time. For a research-driven investor, that is when the work of knowing the businesses matters most.

Can You Invest in the VIX Directly?
No. The VIX is a calculation, not a security, so there is no way to buy the index itself. What exists instead is a set of derivatives built on it: VIX futures, options on those futures, and exchange-traded products that hold the futures. These are trading instruments, and they behave very differently from the headline number.
The main reason is a feature of the futures curve called contango. Most of the time, VIX futures for later months trade at higher prices than the current spot VIX, because the market expects volatility to drift back up from calm levels. A product that holds those futures must continually sell the cheaper near-month contract and buy the more expensive later one, and that roll costs money every month. Over long holding periods the drag has been severe. The prospectuses for these products generally state in plain language that they are intended for short-term trading, not long-term holding.
Understanding the VIX is valuable. Trading it is a specialized activity with its own risks, and for most investors with real wealth to protect, it is not the right tool. The better use of the index is as a window into market conditions while you stay invested in a portfolio built to carry you through them.
How Infinitus Uses the VIX
At Infinitus, Wall Street's fear gauge is context, not a signal. We do not buy or sell because the index crossed a line, and we do not forecast where it is going. What we do is read it the way a pilot reads a weather briefing: it tells us how much turbulence is already priced in, how expensive protection has become, and whether the moment calls for patience or for attention.
In practice that shows up in a few places. The size of a position relative to the portfolio accounts for how much the market expects it to move. The pace at which cash is put to work can be more deliberate when option prices say the next month is unusually uncertain, and more active when a spike has already widened the gap between prices and the businesses behind them. And every client portfolio is designed in advance with the kind of month a high VIX describes in mind, so that the client's time horizon and income needs, not a headline, decide what happens next. That construction work happens at the start of the relationship, which is why our capital preservation approach is a design choice rather than a reaction.
The numbers in this article are the same ones we look at. If you want to see how a portfolio built on this thinking would be constructed around your situation, that conversation is a good place to start.

What Is Wall Street's Fear Gauge Telling You About Your Own Portfolio?
Here is the practical takeaway on how the fear gauge affects your portfolio. The next time you see the VIX at 25, do the arithmetic: that is roughly a 7 percent one-month move, in either direction, as a one-standard-deviation outcome. Then ask a simple question. If your portfolio moved 7 percent next month, would anything about your life change? Would you need to sell? Would you lose sleep?
If the answer is no, the VIX is just information. If the answer is yes, that is not a problem with the market. It is a problem with construction, and construction is fixable. A portfolio sized to your actual time horizon, income needs, and tolerance for movement is built to treat a volatility headline as background noise.
That is the work we do.
See what the fear gauge looks like from inside a portfolio built for it.
Infinitus Wealth Management is a fee-only, independent fiduciary. We build custom portfolios around your time horizon, income needs, and tolerance for movement, so a volatility headline is information rather than a decision. Start with an introductory conversation.
Frequently Asked Questions
Why is the VIX called Wall Street's fear gauge?
Because it rises when investors are paying more for protection on the S&P 500, which usually happens when prices are falling. The VIX measures how much the options market expects the index to move over the next 30 days. Divide it by 3.46 to get the expected one-month move: a VIX of 20 implies a swing of roughly 5.8 percent in either direction.
What is a good VIX number?
There is no good or bad number, only context. Readings in the mid teens are calm, the high teens to around 20 are ordinary, 20 to 30 is elevated, and above 30 signals real stress. The long-run average since 1990 is about 19.5.
What does it mean when the VIX is above 30?
A VIX above 30 means option prices imply a one-month move of roughly 8.7 percent or more. Historically, readings in that range have clustered around corrections and sharp pullbacks, and they have tended to fade within weeks rather than persist for months. Past patterns do not guarantee future results.
Does a high VIX mean the stock market will go down?
Not by itself. The VIX rises when stocks are already falling because demand for protection increases, so it tends to confirm a decline rather than forecast one. It measures expected movement in either direction, not the direction itself.
What is the highest the VIX has ever been?
The record closing high is 82.69 on March 16, 2020. The intraday record is 89.53 on October 24, 2008, during the financial crisis. The record closing low is 9.14 on November 3, 2017.
Should I change my portfolio when the VIX spikes?
If your portfolio was built around your time horizon and income needs, a VIX spike is information rather than a reason to act. If a 7 or 10 percent monthly move would force you to sell or change your plans, that is a construction issue worth addressing before the next spike, not during it.

Disclosures
This article is provided by Infinitus Wealth Management, LLC, a registered investment adviser, for informational and educational purposes only. It does not constitute investment, legal, or tax advice, an offer to buy or sell any security, or a recommendation of any investment strategy. The VIX, S&P 500, and other indexes referenced are unmanaged and cannot be invested in directly. Historical VIX levels, ranges, averages, and the behavior of past spikes are provided for context only; past performance and past market patterns do not guarantee future results. Implied volatility is an estimate derived from option prices and does not predict the direction or magnitude of future market moves. VIX-linked derivatives and exchange-traded products carry significant risks, including the potential for substantial loss, and are not suitable for all investors. Charts and tables are illustrative and may rely on hypothetical or simplified figures. All investing involves risk, including the possible loss of principal. Market data cited is as of the date shown and subject to change. Consult your own financial, legal, and tax professionals regarding your specific situation.