
What Does the September 2026 CPI Report Mean for Your Portfolio?


Erik James Roberts — Founder & CIO, Infinitus Wealth Management. Purple Heart recipient, Wharton MBA.
Updated October 14, 2026
The September 2026 CPI report showed inflation rising to 3.7% over the past year, up from 3.4% in August, with core inflation climbing to 2.6%. Both numbers came in above what economists expected, and the market reacted within minutes: Treasury yields jumped, rate-sensitive stocks sold off, and the odds of another Federal Reserve rate hike at the October 28 meeting went up.
If you watched our video on this report, this is the full write-up. The short version is that inflation is moving the wrong direction for now, higher rates are likely to stay with us longer than most people planned for, and that creates a clearer picture for investors who know what they own and why. Here is what the data says, what it means for stocks, bonds, and housing, and where we see the opportunity.
What the September 2026 CPI report actually showed
The Consumer Price Index rose 0.6% in September on a seasonally adjusted basis, after a 0.4% rise in August. Over 12 months, the all-items index is up 3.7%. That is the fastest annual pace in several months and a step up from two consecutive readings of 3.4%.
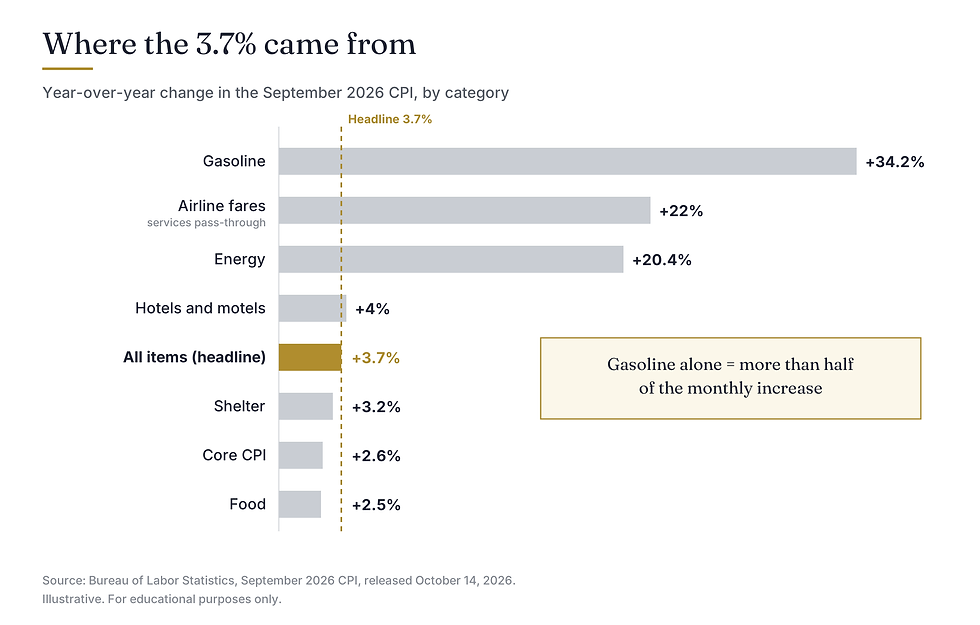
The story inside the number is energy. Gasoline rose 9.1% in September alone and accounted for more than half of the monthly increase. Over the past year, energy is up 20.4% and gasoline is up 34.2%, driven by a Brent crude price that climbed more than 14% in September and finished the third quarter up roughly 42%.
The energy spike is spilling into services. Airline fares are up about 22% over the past year, largely a jet fuel story, and hotel and motel prices are up more than 4%. Shelter inflation edged up to 3.2% from 3.0%.
Not everything rose. The food index was flat for the month, beef prices fell 1% after a temporary tariff reprieve, and communication was one of the few major categories that declined. Food inflation over 12 months actually eased to 2.5% from 2.7%.
Why core inflation matters more than the headline
Headline inflation gets the attention, but the Federal Reserve watches core CPI, which strips out food and energy because those categories swing with weather, geopolitics, and commodity markets. Core is the better read on whether price pressure is spreading through the economy.
That is why this report mattered more than a gasoline spike alone would. Core CPI rose 0.3% for the month, the same as in August, and the annual core rate climbed to 2.6% from 2.4%. Economists had expected 0.2% and 2.5%. On an unrounded basis, core came in at 0.335% against a 0.21% forecast, a bigger miss than the headline's 0.649% against 0.58%.
Two months of 0.3% core readings annualize to roughly 3.7%. That is the figure that tells the Fed the pressure is not just at the pump. It is in airfares, lodging, and shelter, and it is broadening rather than fading.

What this means for the Fed and interest rates
The Fed raised its benchmark rate in mid-September for the first time in three years, after the August report showed inflation running uncomfortably high. The September report is the last inflation reading before the October 27 to 28 meeting, and it strengthens the case for another move rather than a pause.
The bond market responded immediately. Treasury yields rose on the release, which is the market's way of pricing in a higher path for rates. Fannie Mae's latest economic forecast, prepared before this report, already projected the 10-year Treasury yield at 5.3% through 2027 and the federal funds rate averaging 4.4% next year. Those assumptions now look conservative rather than aggressive.
None of this is a forecast from us. The Fed's decision on the 28th depends on data it has not seen yet, including Thursday's producer price index, which economists expect to show wholesale inflation running at 5.5% year over year. What we can say is that the direction of travel has been clear for two months, and portfolios built for a world of falling rates deserve a second look.
How higher rates reach the stock market
Rates do not hit every company the same way, and understanding the mechanics is what separates a reaction from a decision.
First, borrowing gets more expensive for everyone. A company that funded its growth with cheap debt now pays more to roll that debt over, and that cost comes straight out of earnings. Companies with heavy leverage feel it first. Companies with strong balance sheets and real cash flow feel it least, and in some cases benefit as weaker competitors pull back.
Second, the price investors are willing to pay for future earnings falls. When a Treasury bond pays more, a growth stock whose profits are years away has to compete with a safe yield that pays today. That is why rate hikes tend to compress valuations across the board even when the economy is still doing fine.
The bond market gave a vivid example of the first mechanism this week. Yields on the debt of one heavily indebted AI infrastructure provider approached 15% on Wednesday, and its shares fell sharply as investors questioned whether borrowing at that scale still works when money costs more. That is a single company, not the sector, but it shows how quickly credit markets reprice leverage once rates move. We do not hold or recommend any position in it; it is simply the clearest illustration of the mechanism in the news this week.

What the September 2026 CPI report means for housing
For anyone carrying a mortgage, buying a home, or holding real estate, the rate picture moved on the same day. Fannie Mae published its October housing outlook on Wednesday and raised its forecast for the 30-year fixed mortgage rate to 7.4% in the fourth quarter of 2026 and 7.5% through every quarter of 2027. Its prior forecast was 6.8% and 6.7%. The average 30-year rate stood at 7.46% on Tuesday and is likely to move higher after the inflation data.
Those assumptions were set on September 30, before the CPI release, so they may already trail the market. Fannie Mae also cut its 2027 origination forecast by roughly $400 billion and expects home price growth to slow to 0.6% next year from 2.7% this year.
The constructive read: a slower housing market with stable prices is not a crisis. It is a normalization after years of unusually cheap money, and for buyers who were priced out by bidding wars, it opens the door to a more orderly market.

The risks worth watching
There are real risks in this picture, and we would rather name them than talk around them.
Inflation could keep broadening. Two months of 0.3% core readings is a trend, and if October looks the same, the Fed's path gets steeper. Energy is the wild card; Brent above $100 keeps feeding into transport and services costs.
Leverage gets tested. Companies, funds, and projects that assumed rates would fall are now refinancing into a higher-rate world. Most will manage it. Some will not, and credit markets will sort the two faster than headlines will.
Policy adds a variable. BlackRock CEO Larry Fink told CNBC on Wednesday that a moratorium on data center construction would push the economy into recession, because so much of current growth rests on that capital spending. His framing is conditional, and he is not a neutral observer, but the point stands: AI infrastructure has become a large share of the economy, and local opposition to data centers is now a live issue in the November midterms.
None of these are reasons to sit out. They are reasons to know exactly what you own.
Where the opportunity is
Higher rates reward discipline, and that is good news for investors who have it.
Bonds pay again. A high-quality Treasury or corporate bond now offers a real yield that was unavailable for most of the last 15 years. For portfolios built from individual bonds, that means the ability to lock in income at attractive levels and build a ladder around specific future needs.
Quality gets priced correctly. When money is cheap, strong and weak balance sheets trade together. When money costs something, the market starts telling them apart. Companies with pricing power, manageable debt, and real cash flow tend to hold up, and periods like this often create the entry points that look obvious in hindsight.
Dividend income does more work. In a 3% to 4% inflation environment, a growing dividend stream from companies that can raise prices is one of the cleaner ways to keep purchasing power intact.
The common thread is selection. A market that punishes leverage and rewards quality is a market where owning specific securities for specific reasons matters more than owning the index. That is how every Infinitus portfolio is built, and it is why we see this environment as an opportunity rather than a threat.
Frequently asked questions
What was the September 2026 CPI inflation rate?
The Consumer Price Index rose 3.7% over the 12 months ending September 2026, up from 3.4% in August. On a monthly basis, CPI rose 0.6%. Core CPI, which excludes food and energy, rose 2.6% annually and 0.3% for the month.
Why did inflation go up in September 2026?
Gasoline was the main driver. It rose 9.1% in September and accounted for more than half of the monthly increase. Energy overall is up 20.4% over the past year. Core inflation also rose, with airfares, lodging, and shelter all contributing.
Will the Fed raise rates in October 2026?
The Fed meets October 27 to 28, and this report is the last inflation reading before that decision. Economists said the hotter-than-expected numbers make another hike more likely. The outcome depends on data the Fed has not yet seen, so no one can say for certain.
How does higher inflation affect the stock market?
Higher inflation typically leads to higher interest rates, which raise borrowing costs for companies and lower the value investors place on future earnings. Companies with heavy debt tend to be affected most. Companies with strong cash flow and pricing power tend to be more resilient.
What are mortgage rates expected to do in 2027?
Fannie Mae's October 2026 forecast projects the 30-year fixed rate at 7.4% in the fourth quarter of 2026 and 7.5% throughout 2027, up from its prior forecast of 6.8% and 6.7%. The Mortgage Bankers Association also expects rates to stay above 7% next year.
Should I change my portfolio because of the CPI report?
A single report should not drive wholesale changes. It is a good moment to confirm that your portfolio was built for an environment where rates stay higher for longer: appropriate bond exposure, limited reliance on heavily leveraged companies, and income that can keep pace with inflation. If you are not sure, a review is the right next step.
Let's look at your portfolio together
If this report raised questions about what you own, we can help you answer them. Every Infinitus portfolio is built from individual stocks and bonds selected for a specific reason, which makes it straightforward to see how it is positioned for a higher-rate environment. Start with an introductory conversation.


Disclosure. Infinitus Wealth Management is a registered investment adviser. This article is for informational and educational purposes only and does not constitute investment, legal, or tax advice, nor an offer or solicitation to buy or sell any security. Economic data is sourced from the U.S. Bureau of Labor Statistics and other public sources believed to be reliable but not guaranteed. Forecasts cited are those of the named third parties, not Infinitus, and are subject to change. References to specific companies are for illustration of market mechanics only and are not recommendations. Investing involves risk, including possible loss of principal. Past performance is not indicative of future results. Charts are illustrative. Consult a qualified professional regarding your individual situation.
