
Investing in the Semiconductor Industry in the AI Era: Growth Opportunity, Valuation Risk, and What Investors Should Know
- Erik James Roberts, Founder & Chief Investment Officer | Infinitus Wealth Management

- May 11
- 14 min read
Updated: Jun 11


The Claude Risk: What Happens When AI Needs Less Hardware
On the morning of March 18, 2026, the news crossed: Google's DeepMind team had published a paper describing TurboQuant — a compression framework that ran frontier AI models on roughly one-sixth the memory of conventional deployments, with almost no accuracy loss.
By Friday's close, approximately $300 billion in market capitalization had evaporated from the semiconductor complex. Micron Technology dropped 11%. SK Hynix fell 14% in Seoul. Samsung Electronics lost 7%. NVIDIA, which had no direct revenue exposure to the news, fell about 4% in sympathy.
Six weeks later, most of those losses had been recovered. But March 18 marked a turning point in how serious investors are thinking about the AI hardware trade. It was a public, real-time demonstration that the biggest risk to semiconductor demand is not the Federal Reserve, not geopolitics, and not customer discipline. It is software — specifically, the steady advance of algorithmic efficiency.
If you have meaningful exposure to the semiconductor industry — through individual securities, sector ETFs, or simply through broad-market index funds where chipmakers now represent an outsized weight — it is worth understanding what is actually driving this sector. This commentary is intended as an educational walk-through: how the industry is structured, what the data is telling us right now, what the major risks look like, and what questions every investor should be asking their advisor.
Nothing in what follows constitutes a recommendation. Every investor's circumstances are different. The purpose here is to help you ask better questions.
The Trade Almost Everyone Owns
Most diversified investors today hold meaningful semiconductor exposure whether they realize it or not. NVIDIA alone now represents roughly 6 to 7% of the S&P 500. The semiconductor industry as a whole has driven a substantial share of large-cap equity returns over the past three years. Understanding what is happening in the sector is, in effect, understanding what is happening to the broader market.
Here is the context for the current moment. Over the trailing twelve months ending mid-May 2026, several of the most important names in the sector have rallied dramatically off their 52-week lows:
• AMD: approximately +333% from 52-week low
• Amkor Technology: approximately +331%
• Lam Research: approximately +272%
• Marvell Technology: approximately +190%
• Applied Materials: approximately +189%
• Tokyo Electron: approximately +155%
• KLA Corp: approximately +149%
• ASML Holding: approximately +128%
• Taiwan Semiconductor: approximately +119%
• ARM Holdings: approximately +114%
Year-to-date 2026 performance shows the rally has broadened to include memory: SK Hynix is up approximately 189% YTD and Micron approximately 183% YTD. Performance data is sourced from public market quotes as of mid-May 2026.
These figures represent point-in-time observations of historical price performance and are not predictive of future returns. Investors should also note that these same securities have experienced substantial drawdowns in prior periods — the semiconductor sector has historically been highly volatile, and drawdowns of 30 to 50% from peak have been common at cyclical turning points.
The reason the sector has performed this way is structural. AI-related infrastructure spending by the largest cloud providers — Microsoft, Alphabet, Amazon, Meta, and Oracle — has been guided to exceed $400 billion in aggregate for 2026, with the majority targeted toward AI workloads. Sovereign AI initiatives in Saudi Arabia, the UAE, Japan, and India have added to demand. Advanced packaging capacity at the leading-edge foundry, TSMC, is reportedly sold out through 2027. These are real, contracted backlog dynamics. They are also the kind of demand profile that has, in prior technology cycles, eventually peaked and reversed.
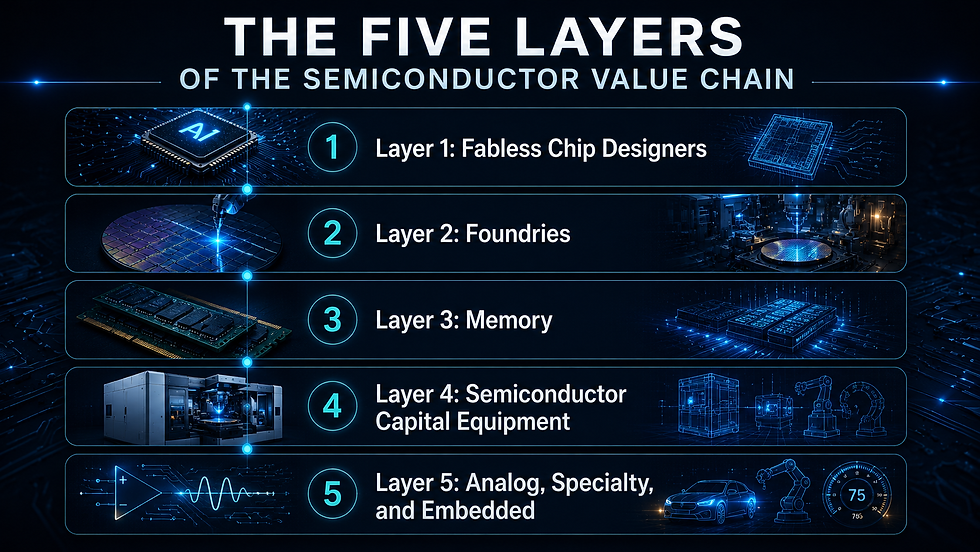
The Five Layers of the Semiconductor Value Chain
One common misunderstanding among non-specialist investors is the assumption that "semiconductors" is a single industry. It is not. The sector consists of at least five distinct sub-industries, each with different economics, different competitive structures, and very different sensitivities to AI demand. Understanding which layer a given company occupies is essential to interpreting valuation and risk.
Layer 1: Fabless Chip Designers
Fabless companies design chips but outsource manufacturing. They retain the intellectual property and typically command the highest gross margins. Major names include NVIDIA, Advanced Micro Devices, Broadcom, Marvell Technology, Qualcomm, Apple (silicon group), and ARM Holdings. This is the layer where the marquee AI accelerator and central processing unit franchises sit. It is also the most volatile layer of the stack: success here depends on architectural leadership, which can shift between competitors.
Layer 2: Foundries
Foundries fabricate chips on contract for fabless customers. The leading edge — process technology at 5 nanometers and below, used in advanced AI accelerators and flagship mobile processors — is effectively a duopoly between Taiwan Semiconductor (TSMC) and Samsung Foundry, with TSMC holding the dominant share. Intel Foundry is attempting to enter the leading-edge market. GlobalFoundries and United Microelectronics operate at trailing nodes. Foundries are capital-intensive businesses historically subject to multi-year cycles.
Layer 3: Memory
The memory market is dominated by three suppliers — Samsung, SK Hynix, and Micron Technology — which together control approximately 95% of global dynamic random-access memory (DRAM) supply. The AI buildout has created a new sub-category, high-bandwidth memory (HBM), where SK Hynix currently leads market share. NAND flash memory remains a more traditional commodity-cyclical business. Memory has historically been the most cyclical segment of the semiconductor industry, with significant peak-to-trough swings in both pricing and earnings.
Layer 4: Semiconductor Capital Equipment
Equipment makers supply the machines used to fabricate chips. ASML Holding produces the extreme ultraviolet (EUV) lithography systems required for leading-edge manufacturing and has no direct competitor at that node. Applied Materials, Lam Research, KLA Corp, and Tokyo Electron round out the four largest wafer-fabrication-equipment suppliers, each dominating specific process steps. These businesses tend to follow foundry and memory capital expenditure cycles.
Layer 5: Analog, Specialty, and Embedded
This segment includes Texas Instruments, Analog Devices, NXP Semiconductors, Infineon Technologies, STMicroelectronics, and Microchip Technology. These companies sell into automotive, industrial, medical, and consumer end markets. They have limited direct AI exposure and have generally underperformed the AI-focused names during the current cycle. They are also currently working through their own end-market downturn, which appears to be in the process of bottoming.
Where Valuations Stand
The table below summarizes consensus valuation and growth data for many of the largest publicly traded semiconductor companies, drawn from public market data sources as of mid-May 2026. The figures are point-in-time and subject to change. They are presented to illustrate the dispersion of valuations across the industry, not to suggest the suitability of any particular security for any particular investor.
Company | Ticker | Fwd P/E | YTD Change | EPS Growth Est. |
NVIDIA | NVDA | 25.80 | +18.12% | +83.33% |
AMD | AMD | 52.40 | +116.66% | +30.21% |
Broadcom | AVGO | 31.93 | +23.98% | +46.84% |
TSMC | TSM | 21.53 | +33.17% | +56.13% |
ASML | ASML | 39.11 | +45.84% | +22.35% |
Applied Materials | AMAT | 35.70 | +73.07% | +12.13% |
Lam Research | LRCX | 39.40 | +72.73% | +30.77% |
KLA Corp | KLAC | 39.66 | +52.01% | +8.80% |
Cadence Design | CDNS | 44.49 | +16.36% | +15.29% |
Synopsys | SNPS | 34.51 | +9.85% | -19.07% |
Marvell | MRVL | 44.39 | +100.69% | +22.58% |
Micron | MU | 8.11 | +183.45% | +893.19% |
SK Hynix | 000660.KS | 5.93 | +188.79% | n/a |
Samsung Electronics | 005930.KS | 5.76 | +138.12% | n/a |
Intel | INTC | 119.08 | +247.24% | n/a |
Qualcomm | QCOM | 22.45 | +37.60% | -14.74% |
ARM Holdings | ARM | 98.71 | +96.09% | -1.82% |
Texas Instruments | TXN | 34.98 | +69.94% | +7.03% |
Analog Devices | ADI | 34.94 | +54.24% | +56.76% |
NXP Semiconductors | NXPI | 19.42 | +38.91% | +9.85% |
Microchip Tech | MCHP | 31.36 | +52.70% | +336.36% |
Amkor Technology | AMKR | 33.95 | +95.57% | +166.67% |
Monolithic Power | MPWR | 64.72 | +81.66% | +15.84% |
Ambarella | AMBA | 105.91 | +12.18% | -85.71% |
GlobalFoundries | GFS | 38.36 | +117.24% | n/a |
United Micro | UMC | 21.88 | +98.16% | +33.33% |
Source: Public market data and sell-side analyst consensus, mid-May 2026. "Top PT Upside" reflects the implied percentage change from the current share price to the top sell-side analyst's published price target. Negative values indicate the current share price exceeds the top published price target. Estimates are not forecasts by Infinitus Wealth Management and are subject to revision.
What the Data Shows
Several observations stand out from the table, presented here for educational purposes:
First, valuation dispersion across the industry is unusually wide. Forward price-to-earnings multiples range from approximately 5.8x at Samsung Electronics to over 100x at ARM Holdings and Ambarella. Intel's optically elevated 119x forward multiple reflects depressed near-term earnings expectations rather than a growth premium and should not be compared directly with growth-oriented multiples elsewhere in the table.
Second, the relationship between growth and valuation is not uniform. Several names in the table are trading at single-digit or low-double-digit forward earnings multiples while exhibiting triple-digit consensus EPS growth — most notably the memory cohort (SK Hynix, Samsung, Micron) and Microchip Technology. Historically, this combination has reflected the market's reluctance to capitalize cyclical earnings at trough multiples. Whether the current cycle in memory should be viewed as cyclical or structurally different is a question reasonable investors disagree on, and it is the central debate in this part of the market today.
Third, NVIDIA's forward earnings multiple has compressed materially over the past year as reported earnings have grown into the valuation. At approximately 25.8x forward earnings, NVIDIA now trades at a lower multiple than several other large-cap semiconductor names in the table. Whether this reflects a more attractive risk-reward or instead signals concerns about earnings sustainability is, again, a question with reasonable arguments on both sides.
What the Analyst Price Targets Are Telling Us
A separate and important observation from the table concerns the rightmost column: the implied upside (or downside) between the current share price and the top sell-side analyst's published price target.
For a majority of the names in this universe, the top published analyst price target sits below the current share price — even at firms maintaining "Strong Buy" ratings.
The pattern includes Micron (top PT implies approximately 40% downside), Intel (approximately 50% downside), Marvell (approximately 28% downside), Qualcomm (approximately 25% downside), Applied Materials (approximately 14% downside), ASML (approximately 13% downside), Lam Research (approximately 10% downside), Texas Instruments (approximately 10% downside), and Advanced Micro Devices (approximately 14% downside).
This is an unusual pattern. In ordinary market conditions, analyst price targets tend to move with share prices, and "Buy" ratings are accompanied by price targets above current quotes. When the official targets diverge from current prices in this direction — with bullish ratings sitting alongside price targets below the market — it generally reflects one of two dynamics: either share prices have risen faster than analyst models have been updated, or analysts are reluctant to publish ratings downgrades in a strong-momentum tape even as their fundamental work suggests fair values have been exceeded.
Two names in the table do show meaningful implied upside per the consensus top price targets: NVIDIA (approximately 23% implied upside) and Ambarella (approximately 23% implied upside). These exceptions reflect different underlying theses — NVIDIA's case rests on continued data-center accelerator demand, while Ambarella's reflects an emerging edge-AI inference thesis.
What an investor does with this information is, ultimately, a question for that investor and their advisor. The data is presented here so that readers are aware of it as part of a complete picture of consensus expectations.
The Algorithmic Efficiency Question
Returning to the event that opened this commentary: the March 2026 TurboQuant episode illustrated a class of risk that did not exist in prior semiconductor cycles. Algorithmic efficiency — the steady improvement in software's ability to do more with less compute — is a continuous process, and any breakthrough that materially reduces the hardware required to run AI models has the potential to affect demand for the very chips that have powered the AI rally.
The historical pattern is informative. The cost per token of running large-language-model inference has fallen by approximately 100x since 2022, driven by a sequence of algorithmic improvements: FlashAttention, grouped-query attention, mixture-of-experts architectures, speculative decoding, low-bit quantization, and now TurboQuant. Each step has shifted the marginal economics of compute slightly in favor of less hardware per query.
There are two distinct schools of thought on what this means for chip demand. Both have reasonable supporting evidence, and a complete view of the sector requires understanding both.

The Bear Case for Hardware: Efficiency as a Headwind
In this view, sharp efficiency improvements reduce the absolute hardware required by AI workloads. If a model that previously required eight high-end accelerators can run on two after compression, large customers may slow or stretch their orders. The visible order backlog can shorten. Premium pricing on specialized memory and accelerators may compress. The most cyclically exposed segment — memory — is generally the first to feel the impact, which is exactly what was observed in the March 2026 market reaction.
The Bull Case for Hardware: Jevons Paradox
Historically, when a resource becomes more efficient, total consumption of that resource has often increased rather than decreased. The economist William Stanley Jevons documented this dynamic in 1865 in the context of coal and steam engines. Applied to AI: every prior reduction in the cost-per-token of inference has been accompanied by an increase in aggregate compute consumption, as cheaper inference unlocks new applications (agents, reasoning, multimodal interaction, video generation, embodied robotics). On a multi-year basis, lower unit costs have historically expanded the total addressable market for the underlying silicon.
How Investors Are Weighing the Two Views
There is no settled answer. Different time horizons produce different conclusions. On a short-term basis (months to a year), efficiency news can produce sharp drawdowns of the kind seen in March 2026. On a multi-year basis, the historical pattern suggests aggregate demand has tended to expand. Either dynamic could dominate going forward, and the outcome is genuinely uncertain. Investors with semiconductor exposure should be aware that elevated volatility around algorithmic-efficiency news is now a structural feature of the sector and should consider whether their position sizing, time horizon, and risk tolerance are appropriate for that volatility profile.
Where the Industry Sits in the Cycle
AI semiconductor risk: Semiconductors have historically been a cyclical industry with peaks and troughs roughly every three to four years, driven by inventory builds and capacity additions. The previous cycle peaked in late 2021, troughed in late 2023, and the current upcycle began in early 2024. By that historical pattern, the industry is now approximately 28 months into an up-cycle that has typically lasted 30 to 36 months.
Two features of the current cycle differ from prior patterns. First, end markets are bifurcated: AI-driven demand is in a strong upcycle while automotive and industrial semiconductor demand has been in its own trough. Two cycles are running simultaneously in opposite directions within the same sector. Second, leading-edge capacity is currently constrained by physics and by the long lead times required to build new fabrication facilities (four to five years and capital expenditures exceeding $20 billion per fab).
Advanced packaging capacity is similarly bottlenecked. These supply constraints mean the traditional risk of cyclical oversupply is, at present, limited for the leading-edge segment.
That does not eliminate cyclical risk. It changes its character. The principal risks to the current cycle are demand-side rather than supply-side: changes in hyperscaler capital expenditure plans, algorithmic efficiency breakthroughs, geopolitical disruption, or macroeconomic conditions that pressure end demand. The traditional inventory-cycle clock is a less reliable guide than it has been historically.

AI Semiconductor Risks Every Investor in the Sector Should Understand
Beyond algorithmic efficiency, several other risks merit consideration when evaluating semiconductor exposure. These are presented as educational background; appropriate weighting depends on individual circumstances.
• Geopolitical risk concentrated in Taiwan. Approximately 90% of leading-edge logic chips are manufactured in Taiwan. Any significant escalation in cross-strait tensions would have material implications for the global semiconductor supply chain and for any portfolio with concentrated semiconductor exposure.
• Export controls and US-China policy. Ongoing restrictions on the export of advanced semiconductor manufacturing equipment and high-end chips to China affect the revenue of multiple companies in the sector, particularly equipment makers, which derive 15 to 30% of revenue from the Chinese market. Future policy changes in either direction are difficult to predict.
• Concentration and index reflexivity. NVIDIA alone represents approximately 6 to 7% of the S&P 500. Passive index flows have amplified both upward and downward moves in the sector. Investors should consider whether their broader market exposure already includes substantial semiconductor weight before adding additional sector-specific positions.
• Hyperscaler capital expenditure dependence. A small group of large cloud computing customers drives the majority of demand for AI-related semiconductors. Material changes in their capital spending plans — whether driven by macroeconomic conditions, return-on-investment evaluations, or strategic shifts — would significantly affect industry demand.
• Interest rate sensitivity. Higher-multiple growth securities, including many in the semiconductor sector, have historically been sensitive to changes in long-term interest rates. The 2022 episode, during which a roughly 200 basis-point move higher in 10-year Treasury yields coincided with a 35% drawdown in the semiconductor index, illustrates this dynamic.
• Sentiment and narrative risk. Markets can correct on shifts in sentiment before underlying fundamentals change. High-multiple sectors are particularly susceptible to drawdowns driven by changes in narrative — for example, an enterprise study showing weaker-than-expected AI adoption, a high-profile model failure, or regulatory action against a major customer.
Four Open Debates Shaping the Sector
Rather than offer recommendations on specific securities, this section frames the four debates that thoughtful investors in the semiconductor space are currently working through. Reasonable investors hold different views on each. The purpose is to help readers identify which questions matter most for their own situations.
Debate 1: Is NVIDIA still expensive?
With NVIDIA's forward earnings multiple now around 25.8x and the consensus top analyst price target implying meaningful upside, some investors argue the multiple has compressed to reasonable levels relative to projected earnings growth. Others argue that those earnings projections embed assumptions about hyperscaler capital expenditure and AI accelerator market share that may not hold over a multi-year horizon. The debate hinges on the durability of current data-center earnings, which is genuinely uncertain. Each investor will need to weigh this question in the context of their own risk tolerance.
Debate 2: Is the memory cohort a value opportunity or a value trap?
Micron, SK Hynix, and Samsung Electronics currently trade at low single-digit and high single-digit forward earnings multiples while exhibiting very high near-term EPS growth. Bulls view this as a structurally undervalued segment benefiting from secular high-bandwidth-memory demand. Bears view it as classic cyclical accounting — the market is appropriately refusing to capitalize peak-cycle earnings at growth-stock multiples. The historical pattern in memory has been deeply cyclical; whether HBM has structurally changed that pattern is the open question. Both views are defensible.
Debate 3: Have equipment and EDA names already done their re-rating?
Equipment names (ASML, Applied Materials, Lam Research, KLA) and electronic-design-automation names (Cadence, Synopsys) have rallied substantially over the past 18 months and now trade at forward multiples in the 35x to 45x range. One view is that this re-rating fairly reflects the durable, less customer-concentrated nature of these businesses. The opposing view is that the multiples now embed strong cycle continuation and offer less margin of safety than at the start of the rally. Investors with existing positions in these names face different decisions than those building exposure today.
Debate 4: Is the contrarian opportunity in analog and automotive semiconductors?
Companies serving automotive and industrial end markets — Texas Instruments, Analog Devices, NXP, Infineon, Microchip — have substantially underperformed AI-focused names during the current cycle. Some investors argue this group represents the contrarian opportunity in the sector, with reasonable valuations, AI-independent demand drivers, and an end-market cycle that may be in the process of bottoming. Others note that these names have historically been more cyclically sensitive to macroeconomic conditions than to secular growth themes, and may face headwinds if global manufacturing activity slows. The recent +52% year-to-date move in Microchip Technology suggests at least some investors are beginning to take the contrarian side.
Closing Thoughts
The semiconductor industry sits at the center of one of the most consequential economic stories of the decade. It also sits at valuations that, by several measures of consensus analyst opinion, have moved meaningfully ahead of underlying fundamentals across a significant portion of the sector. Both observations are accurate. Both should inform how investors think about their exposure.
The analyst price-target data presented earlier is, in this commentary's view, the most important single observation an investor should take from a careful look at the current valuation environment. When the official top published analyst price targets for the majority of names in a sector imply downside from current prices — even alongside maintained "Buy" or "Strong Buy" ratings — that is information worth understanding. It does not predict the path of returns. It does suggest that the easy phase of the trade, in which both fundamentals and multiples were expanding, may have largely played out. From here, returns will likely depend more heavily on earnings delivery than on further multiple expansion.
Whether and how to adjust portfolio exposure in light of these observations is a question that depends entirely on individual circumstances: time horizon, risk tolerance, tax considerations, existing holdings, and broader financial goals. There is no single right answer, and the appropriate response for one investor may be inappropriate for another.
If you have questions about how the dynamics described in this commentary might apply to your own portfolio, or about whether your current exposure to the semiconductor sector is appropriate given your circumstances, that is exactly the kind of conversation Infinitus Wealth Management exists to have. We work with clients to think carefully about sector exposure, risk concentration, and portfolio construction in the context of their complete financial picture.

Build a Strategy for Long-Term Wealth

The High-Net-Worth Wealth Management Checklist for Families With $5M to $25M
Managing Portfolio Risk When Your Income and Stock Are Tied to One Company
Generating Income with Stock Options: Strategies and Insights
Navigating Tax Implications for High Net Worth Individuals: Strategies to Reduce Your Taxes
Important Disclosures
Infinitus Wealth Management is a registered investment advisory firm. This article is provided for educational and informational purposes only and does not constitute investment, tax, legal, or accounting advice. It is not an offer or solicitation to buy or sell any security or to enter into any advisory relationship. Any references to specific strategies, withdrawal rates, tax provisions, or historical figures are general in nature and may not be appropriate for any individual investor.
Past performance is not indicative of future results. All investing involves risk, including the possible loss of principal. Tax laws are complex, change frequently, and have unique application to individual circumstances; please consult a qualified tax professional regarding your specific situation. Social Security rules, Medicare rules, and retirement account regulations are subject to legislative and regulatory change.
The information in this article was believed to be accurate at the time of writing but is not guaranteed. Readers should consult with their own qualified advisors before making any financial decisions specific to their situation.


